
The Management Board makes strategic and operational management decisions based on our Group-wide performance indicators for growth, profitability, liquidity, capital efficiency, and capital management. The most important financial performance indicators for us are explained below and a definition is provided in the glossary of financial terms.
As part of the Fresenius Financial Framework, we have defined ambition levels (growth bands, among others EBIT margin) for the business segments. These serve as an ambition level for the internal management of our business sectors and are benchmarked against leading competitors.
The key figures for the financial performance indicators for 2024 of the Group and the business segments can be found in the Outlook section.
Growth
For Fresenius, currency-adjusted revenue growth, in particular organic revenue growth in the Group and in the business segments, is of central importance for managing revenue growth. It shows the growth of our business that comes from our own resources and not from acquisitions, divestitures, or currency translation and hyperinflation effects. Currency translation effects are the difference between revenue in the reporting period at the exchange rates of the reporting period, less revenues in the reporting period at the exchange rates of the comparative period. A portfolio effect takes place in the case of an acquisition or divestment. Any portfolio effect is excluded for 12 months after the end of the relevant transaction in the reporting or comparative period, after which both current and prior periods fully reflect the portfolio change.
In the Fresenius Financial Framework, organic revenue growth represents the key performance indicator for the Group's growth and that of the business segments. With the Fresenius Financial Framework, we have defined annual organic revenue growth ranges (ambition levels) for the Operating Companies.
Ambition level of annual organic revenue growth
Download(XLS, 35 KB)| OPERATING COMPANIES | Organic revenue growth p.a. |
|---|---|
| Fresenius Kabi | 4-7% |
| Fresenius Helios | 3-5% |
Profitability
At Group level, we primarily use earnings before interest and taxes (EBIT) and EBIT growth in constant currency.
As part of the new Fresenius Financial Framework, we have defined annual margin bands (ambition levels) for the business segments. These serve as an ambition level for the internal management of our business sectors and are benchmarked against leading competitors. The annual EBIT marginEBIT marginEBIT margin is calculated as the ratio of EBIT to revenue. is defined as earnings before interest and taxes divided by revenue.
To improve comparability of operating performance over several periods, the earnings figure is adjusted for special items where necessary.
Ambition level of annual EBIT margin bands
Download(XLS, 35 KB)| EBIT margin bands p.a. | |
|---|---|
| OPERATING COMPANIES | |
| Fresenius Kabi | 14-17% |
| Fresenius Helios | 9-11% |
| INVESTMENT COMPANIES | |
| Fresenius Vamed | 4-6% |
| Fresenius Medical Care1 | 10-14% |
| 1 Deconsolidated as of November 30, 2023 | |
For Fresenius Medical Care and Fresenius Vamed, we present the annual margin band that reflects our expectation as the major shareholder.
Liquidity and dividend
Within the Group, Cash Conversion Rate (CCR)Cash Conversion Rate (CCR)The cash conversion rate is defined as the ratio of adjusted free cash flow (cash flow before acquisitions and dividends; before interest, tax and special items) to operating income (EBIT) before special items. This allows us to assess our ability to generate cash and amongst others, also to pay dividends. was used as the main liquidity indicator in fiscal year 2023. CCR is defined as the ratio of adjusted free cash flowCash flowFinancial key figure that shows the net balance of incoming and outgoing payments during a reporting period. (cash flow before acquisitions and dividends; before interest, tax, and special items) to operating income (EBIT) before special itemsBefore special itemsIn order to measure the operating performance extending over several periods, key performance measures are adjusted by special items, where applicable. Adjusted measures are labelled with “before special items”. A reconciliation table is available within the respective quarterly or annual report and presents the composition of special items.. This allows us to assess our ability to generate cash and pay dividends, among other things. The ambition level for the CCR is around 1.0, considering the growth profile of the respective year.
financial performance indicators 2023
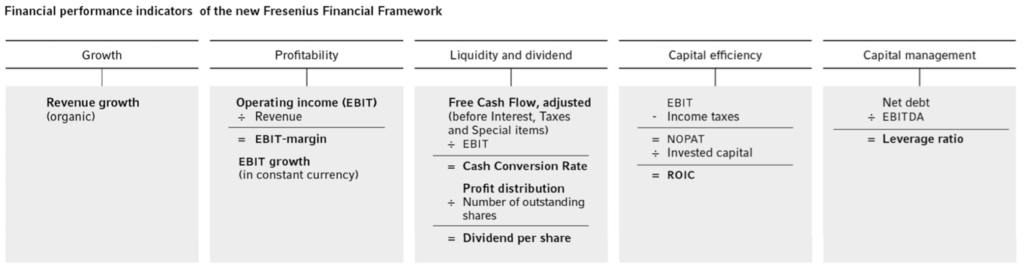
With the Fresenius Financial Framework, Fresenius aims to generate attractive and predictable dividend yields. In line with its progressive dividend policy, the Company aims to increase the dividend in line with earnings per share growth (before special items, in constant currency), but at least maintain the dividend at the prior-years level. However, due to legal restrictions resulting from the utilization of state compensation and reimbursement payments for increased energy costs provided for in the Hospital Financing Act (Krankenhausfinanzierungsgesetz), it will not be proposed to the 2024 Annual General Meeting to distribute a dividend for the 2023 fiscal year.
Notwithstanding the legally required suspension of dividend payments for fiscal year 2023, Fresenius maintains its dividend policy for the future.
Capital efficiency
We work as profitably and efficiently as possible with the capital provided to us by shareholders and lenders.
Under the Fresenius Financial Framework, the Group's capital efficiency is managed on the basis of return on invested capital (ROIC). This serves as an ambition level for the internal management of our Group. We aim to achieve a ROIC of between 6% and 8%.
Capital management
We use the ratio of net debt and EBITDA as the key parameter for managing the capital structure. This measure indicates the degree to which a company is able to meet its payment obligations. Our business segments usually hold leading positions in growing and mostly non-cyclical markets. Since the majority of our customers are of high credit quality, they generate mainly stable, predictable cash flows. According to the management assessment, the Group is therefore able to use debt to finance its growth to a greater extent than companies in other industries.
The self-imposed target corridor for the leverage ratio remains unchanged at 3.0x to 3.5x.
Non-financial performance targets
In fiscal year 2023, sustainability was included as a non-financial performance target in the Management Board compensation system (Short-Term Incentive; STI). The KPIs cover the key sustainability topics of medical quality / patient satisfaction and employees. An additional ESG component is included in the long-term remuneration of the Management Board, as explained in the Remuneration Report.
non financial performance indicators 2023
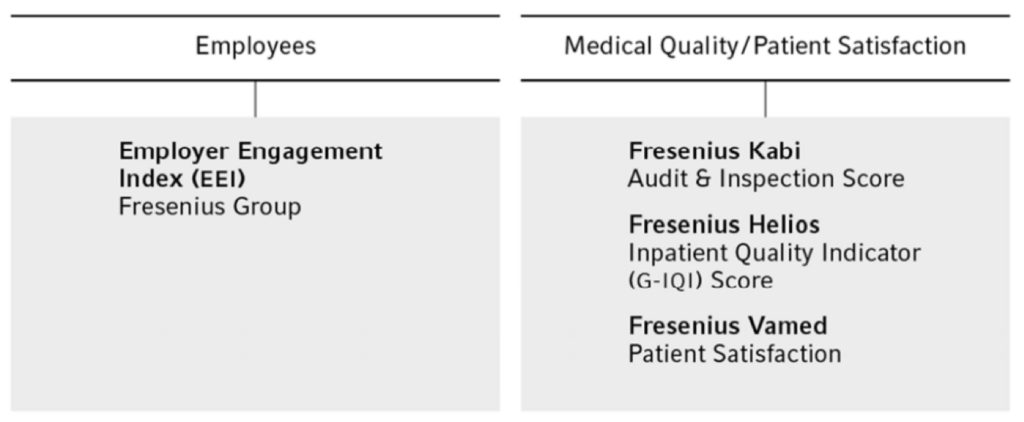
The topic of employees is measured with the key figure of the Employee Engagement Index (EEI) for the Fresenius Group. The indicator measures how positively employees identify with their employer, how committed they feel, and how engaged they are at work. The index is the weighted average of engagement scores derived from a business segments entities included in the survey. The EEI is measured within the range of 1 (strongly disagree) to 6 (strongly agree.
For the 2024 fiscal year, Fresenius is targeting an EEI of 4.33 (corresponds to 100% target achievement).
The Medical Quality / Patient Satisfaction topic is made up of equally weighted key performance indicators defined at business segment level. The three key figures are based on their respective materiality for the business model.
- Fresenius Kabi: Audit & Inspection Score
- Fresenius Helios: Inpatient Quality Indicator
- Fresenius Vamed: Patient Satisfaction Score
The Audit & Inspection Score at Fresenius Kabi is based on the number of critical and serious non-conformances from regulatory GMP inspections and the number of serious non-conformances from TÜV ISO 9001 audits in relation to the total number of inspections and audits performed. The score shows how many deviations were identified on average during the inspections and audits considered (scale >0).
For the 2024 fiscal year, Fresenius Kabi is targeting an Audit & Inspection Score of no more than 2.3 (100% target achievement).
The Inpatient Quality Indicator at Fresenius Helios comprises the measurement of a set of standardized inpatient quality indicators (G-IQI/E-IQI). These are based on routinely collected hospital billing data from hospital information systems. The number of indicators achieved compared to the total number of indicators is calculated to measure the overall success rate.
There is individual target setting and measurement of target achievement in the two Helios segments Helios Germany and Helios Spain. Subsequently, target achievement is consolidated at Helios company level with equal weighting (50% each) for Executive Board compensation. The Inpatient Quality IndicatorInpatient Quality IndicatorThe Inpatient Quality Indicator at Fresenius Helios comprises the measurement of a set of standardized German inpatient quality indicators (G-IQI). These are based on routinely collected hospital billing data from hospital information systems. The number of indicators achieved compared to the total number of indicators is calculated to measure the overall success rate. There is individual target setting and measurement of target achievement in the two Helios segments Helios Germany and Helios Spain. Subsequently, target achievement is consolidated at Helios company level with equal weighting (50% each) for Executive Board compensation. is measured on a scale of 0% to 100%.
For the 2024 fiscal year, Helios Germany is targeting an Inpatient Quality Indicator (G-IQI) score of at least 88% (100% target achievement); an Inpatient Quality Indicator (E-IQI) score of at least 55% (100% target achievement) is targeted for Helios Spain. The differences in the values between the two countries are a result of the adaptation of quality measurement to the German standard in Spain, which was then gradually rolled out in the clinics.
Fresenius Vamed measures the level of patient satisfaction in its healthcare facilities in a continuous and structured process. At or immediately after the point of discharge, each patient receives a questionnaire, which contains at least 16 standardized questions that are evaluated for the patient satisfactionPatient satisfactionFresenius Vamed measures the level of patient satisfaction in the VAMED healthcare facilities and the overall patient satisfaction with the services offered in the VAMED healthcare facilities. Each patient receives a questionnaire at or immediately after discharge, which contains 16 standardized questions that are evaluated for the patient satisfaction target. target. Patient satisfaction is measured on a scale from 1 (very satisfied) to 5 (not satisfied).
Fresenius Vamed aims to achieve a patient satisfaction rating of at least 1.57 in the 2024 fiscal year (100% target achievement).
Investment and acquisition process
Against the backdrop of debt, Fresenius pursues a targeted capital allocation with a focus on deleveraging. Our investments and acquisitions are carried out based on a detailed coordination and evaluation process. As a first step, the Management Board sets the Group's investment targets and the budget based on investment proposals. In the next step, the respective business segments and the internal Acquisition & Investment Council (AIC) determine the proposed projects and measures, taking into account the overall strategy, the total investment budget, and the required and potential return on investment. We evaluate investment projects based on commonly used methods, such as internal rate of return (IRR) and net present value (NPV). Within the framework of the due diligence process, opportunities and risks associated with the potential acquisition target are analyzed and assessed. To this end, we review the business model, the key financial figures and tax issues, and the resulting company valuation. In addition, we comprehensively analyze the market and competitive environment, the regulatory framework, and the legal aspects. The audit also covers various issues relating to compliance, production, research and development, quality, information technology, human resources, and the environment. Based on investment volume, a project is submitted for approval to the executive committees or respective managements of the business segments, to the Group Management Board of Fresenius Management SE, and / or, if applicable, also additionally for the consent of its Supervisory Board.
You can find more details on our key performance indicators in our interactive tool on our website.
Development of financial performance indicators 5 years
Group1
Download(XLS, 38 KB)| Ambition levels | Targets 20233 | 2023 | 2022 | 2021 | 2020 | 2019 | |
|---|---|---|---|---|---|---|---|
| Revenue growth ex FMC (organic) | - | Growth in a mid-single-digitpercentage range | 6% | 5% | 6% | 3% | 5% |
| EBIT growth ex FMC (in constant currency) | - | Broadly flat | 2% | -10 | 12% | -8% | 2% |
| Liquidity and capital management | |||||||
| Cash conversion rate ex FMC | Around 1 | Below 1 | 1.0 | 0.9 | 0.9 | 0.8 | 0.5 |
| Net debt / EBITDA ex FMC2 | 3.0-3.5x | Below 4.0x | 3.76x | 3.80x | 3.64x | 4.12x | 3.93x |
| Capital efficiency | |||||||
| Return on invested capital (ROIC) ex FMC | 6-8% | Around 5% | 5.2% | 5.6% | 6.2% | 5.9% | 6.7% |
Business segments1
Download(XLS, 36 KB)| Ambition levels | Targets 20233 | 2023 | 2022 | 2021 | 2020 | 2019 | |
|---|---|---|---|---|---|---|---|
| Fresenius Kabi | |||||||
| Revenue growth (organic) | 4-7% | Mid-single-digitpercentage growth | 7% | 3% | 4% | 4% | 4% |
| EBIT margin | 14-17% | Around 14% | 14.3% | 13.8% | 16.0% | 15.7% | 17.4% |
| Fresenius Helios | |||||||
| Revenue growth (organic) | 3-5% | Mid-single-digitpercentage growth | 5% | 6% | 7% | 4% | 5% |
| EBIT margin | 9-11% | Within structural EBIT margin bandof 9-11% | 10.0% | 10.1% | 10.3% | 10.4% | 11.1% |
| Fresenius Vamed | |||||||
| Revenue growth (organic) | - | Low- to mid-single-digitpercentage range | 1% | 2% | 11% | -8% | 16% |
| EBIT margin | 4-6% | Clearly below structural EBIT margin bandof 4-6% | -0.7% | 0.8% | 4.4% | 1.4% | 6.1% |
| 1 The previous year's figures were adjusted due to the application of IFRS 5 to the deconsolidated activities of Fresenius Medical Care. Growth rates are based on the assumptions of the respective annual forecasts and are adjusted for special items and, if applicable, other effects affecting the underlying growth (adjustments to new accounting standards, acquisitions / divestments, acquisition costs, or cost-saving programs). |
|||||||
| 2 Both net debt and EBITDA calculated at LTM average exchange rates; pro forma closed acquisitions / divestitures; before special items; including leasing liabilities and Fresenius Medical Care dividend | |||||||
| 3 Most recent October 2023 | |||||||
Development of non-financial performance indicators
Download(XLS, 38 KB)| Ambition levels | Targets 20233 | 2023 | 2022 | 2021 | 2020 | 2019 | |
| Employees | |||||||
| Employee Engagement Index (EEI) | 4.33 | 4.241 | Qualitative measurement | Qualitative measurement | n.a. | n.a. | |
| Medical Quality / Patient Satisfaction | |||||||
| Fresenius Kabi Audit & Inspection Score | no more than 2.3 | 1.9 | Qualitative measurement | Qualitative measurement | n.a. | n.a. | |
| Fresenius Helios Germany Inpatient Quality Indicator (G-IQI) Score | at least 88% | 88.7% | Qualitative measurement | Qualitative measurement | n.a. | n.a. | |
| Fresenius Helios Spain Inpatient Quality Indicator (G-IQI) Score | at least 55% | 76.7% | Qualitative measurement | Qualitative measurement | n.a. | n.a. | |
| Fresenius Vamed Patient Satisfaction | at least 1.65 | 1.56 | Qualitative measurement | Qualitative measurement | n.a. | n.a. | |
| 1 Including Fresenius Medical Care | |||||||
Contact
Fresenius SE & Co. KGaA
Investor Relations
+49 (0) 6172 608-2485
ir-fre@fresenius.com