Climate change and its effects are also impacting Fresenius: in healthcare facilities, we have to prepare for rising temperatures and the increase in severe weather events in order to continue to protect the health of patients in the best way possible.
Another current challenge is that energy is becoming more and more expensive, especially if it is obtained from dwindling fossil resources. Our production processes and the operation of healthcare facilities require a high level of energy input. Energy-efficiency measures can lead to short- and long-term cost savings. In addition, through the increased usage and generation of renewable energies, we also want to make an important contribution to climate protection.
Our goals and ambitions
We survey our Scope 1 and Scope 2 emissions annually in order to identify emissions-intensive activities and derive reduction measures. For example, we are introducing new technologies with a lower environmental impact which can improve the energy efficiency of our processes and thus lead to lower greenhouse gas emissions. We are also working on recording our Scope 3 emissions so that we can also include emissions from the upstream and downstream supply chain in our climate goals.
Climate protection goals
Download(XLS, 36 KB)| Timeframe | Status 2023 | Further information | |
|---|---|---|---|
| Expansion of the coverage of energy management systems: Introduction of ISO 50001 at all production sites. | By 20261 | Coverage of manufacturing plants: 74% | Guidelines and regulations |
| Group climate target: | Greenhouse gas emissions | ||
| Reduction of total Scope 1 and Scope 2 emissions by 50% in absolute terms (base year 2020) | By 2030 | Reduction of total Scope 1 and 2 emissions by about 22% in absolut terms. | |
| Climate neutrality by 2040 | By 2040 | ||
| Assessment of Scope 3 emissions for inclusion in the targets as well | Ongoing | The assessment of Scope 3 emissions will be completed during the 2024 reporting year. | |
| Reduction of energy consumption of German Helios clinics by 20% (base year: 2021). | By 2023 | Target not achieved. | Energy consumption |
| Fresenius Kabi: Reduction of emissions (Scope 1 and 2) at our production sites by a single digit percentage annually. | Annually | Goal achieved. | Energy consumption |
| 1 Implementation will be concluded at all Fresenius Kabi production sites in 2026. The certification issuance from the individual certification companies may extend into the following year. Coverage applies to entities already certified or for which a certification is planned. | |||
Our approach
In energy management and climate protection, our aim is to go beyond the legal framework to identify ways of minimizing the impact on the climate and the environment and to implement these in our management approaches. In the reporting year, we focused primarily on the topics of energy saving, purchasing green electricity, and thus the corresponding reduction of respective CO2 emissions.
Uninterrupted energy supply, see the following explanations, is a top priority for Fresenius in order to ensure patient safety and reliable production or care. Within this context, we implement energy-saving measures wherever possible.
Guidelines and regulations
The energy management system is geared to the requirements of our business models and is certified according to ISO 50001. We aim to expand the number of certified sites.
Entities certified according to ISO 500011
Download(XLS, 36 KB)| ISO 50001, in % | Coverage2 |
|---|---|
| Entities, total | 82 |
| Within the healthcare products market segment | 74 |
| Within the healthcare services market segment | 84 |
| 1 Scope applies to the entities for which environmental data is consolidated. |
|
| 2 Coverage applies to entities already certified or for which a certification is planned, depending on the applicability of standards or policies. The certification issuance from the individual certification companies may extend into the following year. | |
We review the effectiveness of our management systems through internal audits and carry out independent audits, as presented in the Environmental management section. These external certification audits are carried out using a multi-site model, for example. The model foresees the audit of a representative sample of sites.
In 2023, prescribed audits were carried out in the business segments. No systematic deviations were identified.
Uninterrupted power supply in healthcare facilities
In recent years, refrigeration technology, which serves to cool technical equipment and hospital rooms, has become more important for hospital operations than heat generation. In addition, more frequent severe weather events may pose a threat to the smooth healthcare services of hospitals.
In order to ensure an uninterrupted energy supply at all times, every hospital has a mains backup system: in the event of a power outage, this system guarantees a secure supply of electricity for the principal energy consumers in the clinics within a few seconds. To safeguard this protection, these emergency power systems are inspected and tested regularly – monthly in Germany and at least once a year in Spain. In addition, we increase the security of the energy supply through self-generated electricity – Helios Germany, for example, covers 25% of its total electricity consumption through self-generated electricity.
Energy consumption
Group energy consumption by source
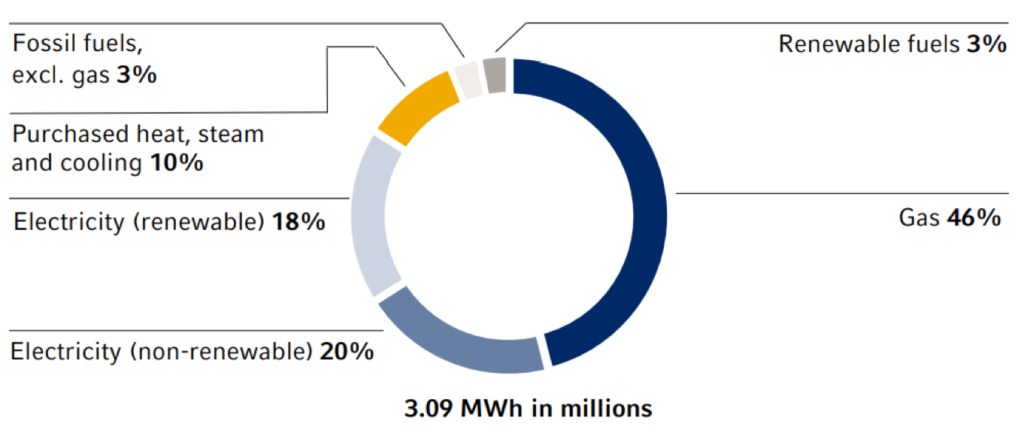
In 2023, Fresenius consumed a total of 3.09 million MWh of energy, a decrease of 3% compared to the previous year. In the reporting year, we again focused our activities on energy efficiency measures and increasing our renewable energy usage across the Fresenius Group. Our main energy sources remain gas and electricity.
Absolute energy consumption1
Download(XLS, 37 KB)| MWh in millions | 2023 | 2022 | 2021 |
|---|---|---|---|
| Fresenius Kabi | 1.76 | 1.80 | 1.77 |
| Fresenius Helios | 1.15 | 1.19 | 1.26 |
| Fresenius Vamed | 0.18 | 0.19 | 0.19 |
| Total | 3.09 | 3.18 | 3.22 |
| 1 Data of Fresenius Helios expanded in 2022 and 2023 to further entities. | |||
Relative energy consumption
Download(XLS, 35 KB)| in MWh | 2023 | 2022 | 2021 |
|---|---|---|---|
| Energy consumption / €1 million sales | 140 | 149 | 163 |
| Energy consumption / FTE | 19.6 | 20.7 | 21.7 |
Expansion of renewable energies
We derive energy to 99.7% from external providers. This includes the purchase of renewable energy such as hydropower, solar, or wind power. We are exploring the use of renewable energies and already generate our own electricity at numerous production sites and clinics, e. g., via combined heat and power systems or solar panels.
In 2023, we purchased around 551,260 MWh of renewable electricity. We also use energy from photovoltaic and biomass plants or from thermal and electrical cogeneration and pellet boilers.
Fresenius Kabi, for the first time, purchased green electricity for seven production sites in 2023. We intend to achieve a 6% annual reduction in Scope 1 and Scope 2 emissions. We plan to continue theses activities for the following years. Fresenius Kabi also operates photovoltaic systems at six of its production sites, and two more were approved for operation in 2023. These will be completed in 2024.
Helios Spain commissioned three new photovoltaic systems on the roofs of hospitals in Málaga, Marbella and Toledo in 2023, bringing the total number to 23. Fresenius Helios switched to 100% certified green electricity in Germany in 2022. With these efforts, we increased the share of renewable electricity consumption across the Group from about 12% in 2022 to about 18% in 2023.
Increase in energy efficiency
To increase energy efficiency in buildings, the performance of relevant energy consumers is measured, compared with more energy-efficient systems, and finally a decision is made about retrofitting. In this way, efficient as well as economically sensible solutions are used – such as LED lamps or heating, ventilation, and air conditioning systems (HVAC). In the healthcare products market segment, we are gradually retrofitting the fans in a total of 21 HVACs at one of our production sites. In 2023, five systems were retrofitted. Fresenius further invests in new buildings and modernizations that meet the latest energy standards and legal requirements.
The air conditioning systems in our hospitals in Spain are responsible for a large proportion of the total energy consumption of Helios Spain. Since 2011, we have been working on automating the management of these devices and have implemented this mode of operation in ten hospitals already. For example, when outside temperatures drop, the systems adjust their output automatically. This allows us to better adapt to increasingly frequent, abrupt, and extreme temperature changes and save energy through more efficient use.
Greenhouse gas emissions
To achieve our Group-wide climate targets, we have established a group of experts who are working on the implementation of appropriate reduction measures across all business segments.
In the reporting year, Fresenius generated a total of 5311 thousand t CO2e (2022: 641 thousand t CO2e). Our Scope 1 emissions account for 308 thousand t CO2e and could be decreased by 2% compared to the previous year (2022: 315 thousand t CO2e). This decrease was due to overall lower energy consumption this fiscal year, achieved partly as a result of our energy efficiency measures. Our Scope 2 emissions (market-based) of 223 thousand t CO2e already reflect the emission reduction from the increased share of renewable electricity. Scope 2 emissions calculated according to the location-based approach amounted to 431 thousand tons of CO2e.
In comparison to the 2020 base year, we reduced our total Scope 1 and 2 emissions by about 22% in absolut terms. This puts us on track to meet our Group climate target.
An overview of total emissions according to the location-based approach can be found below.
We have launched a project to reduce Scope 1 emissions at five production sites which will serve as pilot sites. The first step is to examine the technical conditions for reduction potential. Subsequently derived measures are expected for 2024.
GHG emissions Scope 1 and 2 (market-based approach)2
Download(XLS, 39 KB)| t CO2 equivalents in thou. | 20233 | 20223 | 20213 | 20203 |
|---|---|---|---|---|
| Fresenius Kabi | 324 | 425 | 416 | 396 |
| Scope 1 | 168 | 169 | 172 | 160 |
| Scope 2 | 155 | 256 | 243 | 237 |
| Fresenius Helios | 181 | 189 | 305 | 253 |
| Scope 1 | 120 | 126 | 132 | 125 |
| Scope 2 | 60 | 63 | 173 | 128 |
| Fresenius Vamed | 27 | 27 | 44 | 32 |
| Scope 1 | 19 | 20 | 21 | 19 |
| Scope 2 | 7 | 7 | 22 | 13 |
| Total | 5311 | 641 | 764 | 681 |
| Scope 1 | 308 | 315 | 326 | 305 |
| Scope 2 | 223 | 326 | 438 | 377 |
| 1 The key performance indicators as part of the long-term variable remuneration (LTI) of the Management Board are audited with reasonable assurance, as explained on pages 201 ff. in the independent practitioner´s report of the Group Non-financial Report. | ||||
| 2 The Scope 2 emissions are calculated in accordance with the Greenhouse Gas Protocol, following the market-based emission calculation approach for all business segments. Due to improved data availability, the total Scope 1 and Scope 2 values differ from the values published in 2022. |
||||
| 3 The Scope 1 and 2 emissions from 2020 to 2023 were audited with limited assurance. | ||||
Relative GHG emissions Scope 1 and 24
Download(XLS, 38 KB)| t CO2 equivalents | 2023 | 2022 | 2021 | 2020 |
|---|---|---|---|---|
| t CO2 equivalents / €1 million sales | 24 | 30 | 39 | 37 |
| t CO2 equivalents / FTE | 3.4 | 4.2 | 5.2 | 4.7 |
| 4 The calculation is based on market-based emissions. | ||||
GHG Emissions Scope 1 and 2 (location-based approach)5
Download(XLS, 38 KB)| t CO2 equivalents in thou. | 20233 | 20223 | 20213 | 20203 |
|---|---|---|---|---|
| Fresenius Kabi | 445 | 441 | 443 | 421 |
| Scope 1 | 168 | 169 | 172 | 160 |
| Scope 2 | 276 | 272 | 271 | 261 |
| Fresenius Helios | 258 | 264 | 289 | 302 |
| Scope 1 | 120 | 126 | 132 | 125 |
| Scope 2 | 138 | 138 | 156 | 176 |
| Fresenius Vamed | 36 | 37 | 39 | 39 |
| Scope 1 | 19 | 20 | 21 | 19 |
| Scope 2 | 17 | 16 | 18 | 19 |
| Total | 740 | 742 | 771 | 761 |
| Scope 1 | 308 | 315 | 326 | 305 |
| Scope 2 | 431 | 427 | 445 | 456 |
| 3 The Scope 1 and 2 emissions from 2020 to 2023 were audited with limited assurance. | ||||
| 5 The Scope 2 emissions are calculated in accordance with the Greenhouse Gas Protocol, following the location-based emission calculation approach for all business segments. Due to improved data availability, the total Scope 1 and Scope 2 values differ from the values published in 2022. | ||||
1 The key performance indicators as part of the long-term variable remuneration (LTI) of the Management Board are audited with reasonable assurance, as explained on pages 201 ff. in the independent practitioner´s report of the Group Non-financial Report.
2 The Scope 2 emissions are calculated in accordance with the Greenhouse Gas Protocol, following the market-based emission calculation approach for all business segments. Due to improved data
availability, the total Scope 1 and Scope 2 values differ from the values published in 2022.
3 The Scope 1 and 2 emissions from 2020 to 2023 were audited with limited assurance.
4 The calculation is based on market-based emissions.
5 The Scope 2 emissions are calculated in accordance with the Greenhouse Gas Protocol, following the location-based emission calculation approach for all business segments. Due to improved data availability, the total Scope 1 and Scope 2 values differ from the values published in 2022.
Contact
Fresenius SE & Co. KGaA
Group ESG
sustainability@fresenius.com