Financial management policies and goals
The financing strategy of the Fresenius Group has the following main objectives:
- Ensuring financial flexibility
- Maintaining our investment grade rating
- Limiting refinancing risks
- Optimizing our cost of capital
Ensuring financial flexibility is key to the financing strategy of the Fresenius Group. Our investment grade rating provides us with good access to the financial and capital markets. We also remain financially flexible by maintaining adequate liquidity headroom.
Our refinancing risks are limited due to a balanced maturity profile that is characterized by a broad range of maturities with a high proportion of mid- and long-term debt up to 2033. In the selection of financing instruments, we take into account criteria such as market capacity, investor diversification, funding flexibility, cost of capital, and the existing maturity profile. We also take into account the currencies in which our returns and cash flows are generated.
Our main mid- and long-term financing instruments are bonds, as shown in the chart below. Fresenius SE & Co. KGaA has a Debt Issuance Program, under which bonds of up to €15 billion can be issued in different currencies and maturities. Other important long-term financing instruments include Schuldschein Loans and bank loans. Fresenius pursues a centralized financing strategy. The business segments Fresenius Kabi, Fresenius Helios, and Fresenius Vamed are financed primarily through Fresenius SE & KGaA in order to avoid structural subordination.
Currency derivatives are used at Group level to hedge intercompany loans in foreign currencies. For short-term financing needs, Fresenius SE & Co. KGaA maintains bilateral credit lines and commercial paper program. Under the commercial paper programs, short-term notes of up to €1.5 billion can be issued.
Moreover, lease liabilities (according to IFRS 16) as well as accounts receivable programs are part of our short- and mid-term financing. The €2 billion syndicated ESG-linked credit facility of Fresenius SE & Co. KGaA signed in July 2021 serves as a backup line.
Another key objective of the Fresenius Group's financing strategy is to optimize the cost of capital by employing an adequate mix of equity and debt. Due to the Company's diversification within the healthcare sector and the strong market positions of the business segments in global, growing, and non-cyclical markets, we are able to generate predictable and sustainable cash flows. These allow for a reasonable proportion of debt. Measures to strengthen the equity base may also be considered in exceptional cases to support long-term growth.
financing mix of the fresenius group1
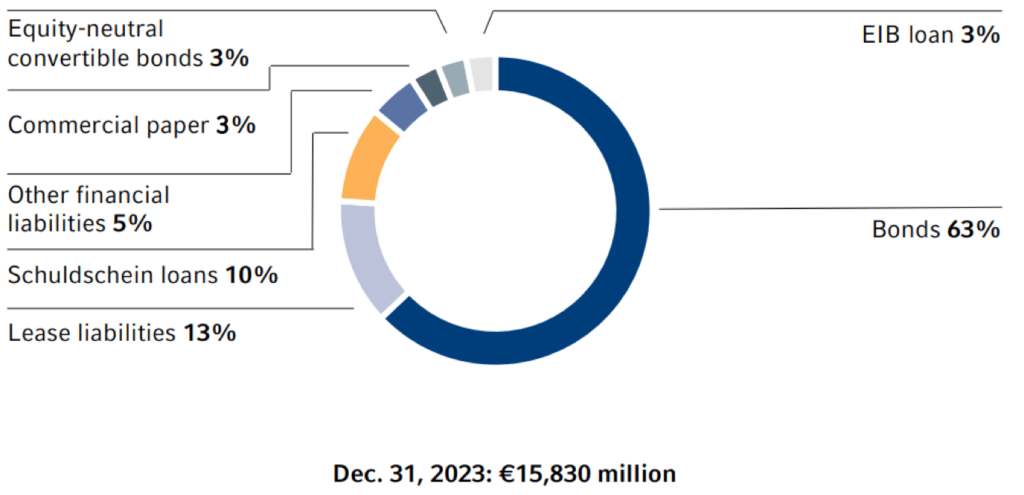
1 As of December 31, 2023. Major financing instruments excluding interest liabilities. Interest liabilities can be found in "Other Financial Liabilities".
Overall, there were no significant changes in our financing strategy in 2023. Against the backdrop of the volatile capital market environment, however, upcoming maturities were refinanced conservatively and well in advance. For example, with the €850 million ESG-linked Schuldschein Loan in May and the €500 million bond in October, we already refinanced maturities in the first quarter of 2024. In addition, an inaugural Swiss franc bond in the amount of CHF 275 million was issued in October to further diversify our financing mix. The average maturity of our major financing instruments (excluding leasing) as of December 31, 2023 was 3.6 years and the average cost of interest was 2.9%.
Financing
Fresenius meets its financing needs through a combination of operating cash flows generated in the business segments and short-, mid-, and long-term debt. Important financing instruments include bonds, Schuldschein Loans, bank loans, convertible bonds, commercial paper programs, and accounts receivable programs. In addition, our financing mix includes lease liabilities in accordance with IFRS 16. In 2022, the proceeds of the financing activities were mainly used for general corporate purposes, including the refinancing of existing financial liabilities.
In 2023, two bonds were issued under the Debt Issuance Program of Fresenius SE & Co. KGaA. The syndicated credit facility was undrawn as of December 31, 2023. As of December 31, 2023, €470 million of Fresenius SE & Co. KGaA's the commercial paper program was utilized.
To ensure short-term liquidity, Fresenius can also conclude bilateral credit lines with banks that can be drawn at any time.
maturity profile of the fresenius group financing facilities1,2
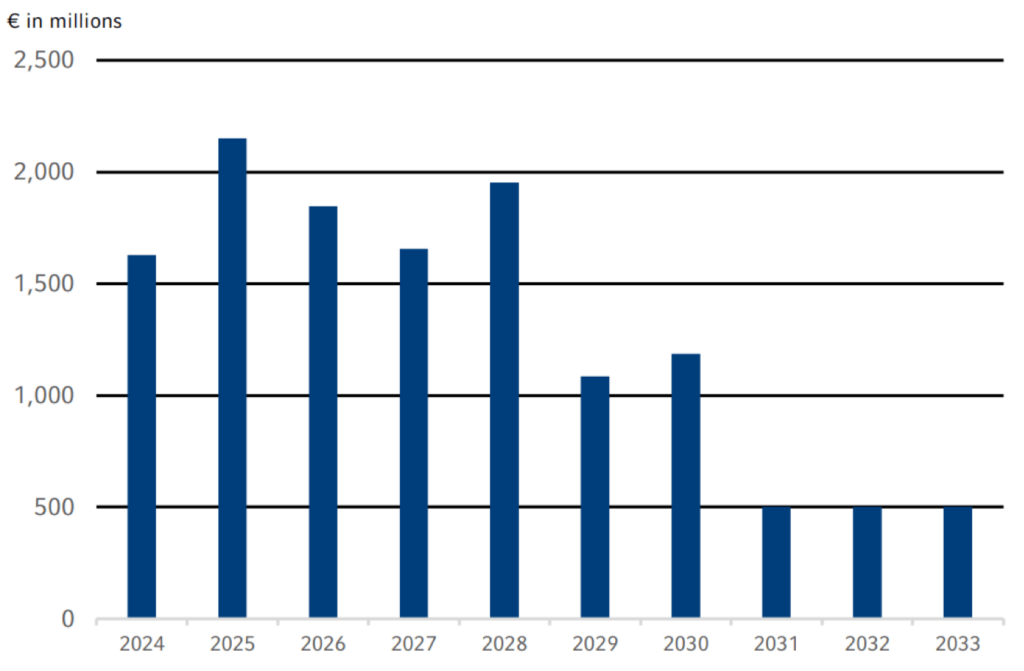
1 As of December 31, 2023, and based on utilization of major financing instruments, excl. Commercial Paper and other cash management lines
2 €700 million Bond 2017 / 2024 , €246 million Schuldschein Loan 2017 / 2024 and €500 million Equity-neutral Convertible Bond 2017 / 2024 repaid at maturity.
Financial position five-year overview1
Download(XLS, 38 KB)| € in millions | 2023 | 2022 | 2021 | 2020 | 2019 |
|---|---|---|---|---|---|
| Cash conversion rate | 1.0 | 0.9 | 0.9 | 0.8 | 0.5 |
| Investments in property, plant and equipment, net | 1,107 | 1,089 | 1,188 | 1,330 | 1,320 |
| Cash flow before acquisitions and dividends | 1,024 | 942 | 1,401 | 986 | 376 |
| as % of sales | 4.6% | 4.4% | 7.0% | 5.3% | 2.1% |
| 1 Prior-year figures were adjusted due to the application of IFRS 5 to the deconsolidated activities of Fresenius Medical Care. | |||||
Corporate rating
The credit quality of Fresenius is assessed and regularly reviewed by the leading rating agencies Moody's, Standard & Poor's, and Fitch. Fresenius is rated investment grade by all three rating agencies. In February, Standard & Poor's changed the outlook from stable to negative. The rating agency Fitch increased the outlook from negative to stable in August 2023. Other than that, there were no rating changes in 2023.
Rating of Fresenius Se & Co. KGaA
Download(XLS, 35 KB)| Dec. 31, 2023 | Dec. 31, 2022 | |
|---|---|---|
| Standard & Poor's | ||
| Corporate Credit Rating | BBB | BBB |
| Outlook | negative | stable |
| Moody's | ||
| Corporate Credit Rating | Baa3 | Baa3 |
| Outlook | stable | stable |
| Fitch | ||
| Corporate Credit Rating | BBB- | BBB- |
| Outlook | stable | negative |
Effect of off-balance-sheet financing instruments on our financial position and liabilities
Fresenius is not involved in any off-balance-sheet transactions that are likely to have a significant impact on its financial position, results of operations, liquidity, investments, assets and liabilities, or capitalization at present or in the future.
Liquidity analysis
The main sources of liquidity are cash provided by operating activities and cash used in financing activities, i.e. short-, mid- and long-term borrowings. Cash flows from operating activities are influenced by the profitability of Fresenius business and by working capitalWorking capitalCurrent assets (including prepaid expenses) - accruals - trade accounts payable - other liabilities - deferred income., in particular receivables. Cash inflows from financing activities are generated through the use of various short-term financing instruments. To this end, we issue commercial paper and draw on bilateral bank credit lines. Short-term liquidity requirements can also be covered by accounts receivable programs. Mid- and long-term financing is mainly provided by bonds, Schuldschein Loans, bilateral credit lines, and leasing liabilities. Fresenius has access to the €2 billion syndicated revolving credit facility as additional liquidity headroom. Fresenius is confident that the existing credit facilities, inflows from further debt financings, and cash inflows from operating activities and other short-term financing sources will be sufficient to cover the Group's foreseeable liquidity needs.
Dividend
For 2022, a dividend of €0.92 per share was paid (2021: €0.92 per share). This resulted in a total payout of €518 million (2021: €514 million, thereof €147 million in shares as part of the scrip dividend).
Due to legal restrictions resulting from the utilization of state compensation and reimbursement payments for increased energy costs provided for in the Hospital Financing Act ("Krankenhausfinanzierungsgesetz"), it will not be proposed to the 2024 Annual General Meeting to distribute a dividend for the 2023 fiscal year. Irrespective of the legally required suspension of dividend payments for the 2023 fiscal year, Fresenius is maintaining its dividend policy for the future.
Cash flow analysis
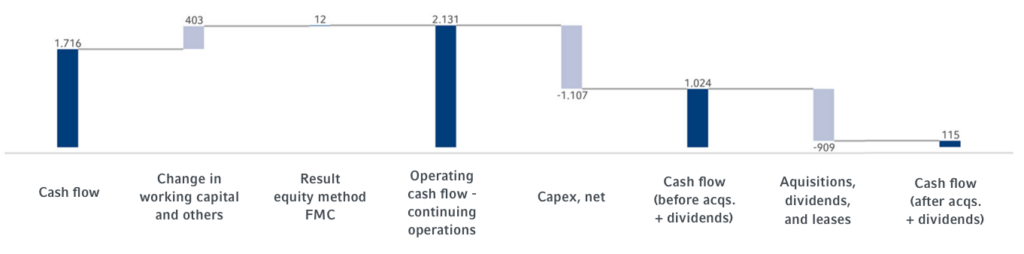
Operating cash flowCash flowFinancial key figure that shows the net balance of incoming and outgoing payments during a reporting period. (continuing operations) increased by 5% to €2,131 million (2022: €2,031 million). Operating cash flowOperating cash flowOperating cash flow is a financial measure showing cash inflows from operating activities during a period. Operating cash flow is calculated by subtracting non-cash income and adding non-cash expenses to net income. (continuing operations) in the 2023 fiscal year was mainly driven by the good development at Fresenius Kabi and Fresenius Helios. This was mainly due to working capital improvements, which were driven, among other things, by improved receivable collection. The cash flow margin was 9.6% (2022: 9.4%).
Capital expenditures (net) amounted to -€1,107 million (2022: -€1,089 million). As a result, the cash flow before acquisitions and dividends (continuing operations) was €1,024 million (2022: €942 million).
The net cash outflow for acquisitions amounted to €233 million. Acquisition expenses mainly related to already-planned milestone payments in connection with the acquisitions of Ivenix Inc., and the biosimilarsBiosimilarsA biosimilar is a drug that is “similar” to another biologic drug already approved. business of Merck KGaA, both at Fresenius Kabi. Fresenius Helios and Fresenius Vamed did not make any acquisitions in 2023.
Dividends of the Group amounted to €444 million (2022: €276 million). The dividend amount is calculated as follows: in total, there was a dividend payment of €518 million to the shareholders of Fresenius SE & Co. KGaA and dividends paid to third parties of €32 million. These payments were partially offset by the dividend of €106 million that Fresenius SE & Co. KGaA received as a shareholder of Fresenius Medical Care.
Free cash flow after acquisitions and dividends (continuing operations) was €347 million (2022: -€117 million).
Payments from lease liabilities resulted in a cash outflow of €232 million (2022: -€200 million).
As a result, the free cash flow after acquisitions, dividends and leases (continuing operations) amounted to €115 million (2022: -€317 million).
cash flow in € millions
Cash provided by financing activities was €972 million, (2022: €377 million), mainly due to the early refinancing of financial liabilities maturing in the 2024 financial year.
Cash and cash equivalents (net), as a result, increased by €1,044 million (December 31, 2022: €57 million) to €2,562 million as of December 31, 2023. They were negatively influenced by currency translation effects of -€43 million (2022: -€2 million).
The cash conversion rate (CCR), which reflects the ratio of adjusted free cash flow to EBIT before special itemsBefore special itemsIn order to measure the operating performance extending over several periods, key performance measures are adjusted by special items, where applicable. Adjusted measures are labelled with “before special items”. A reconciliation table is available within the respective quarterly or annual report and presents the composition of special items., improved to 1.0 in the 2023 fiscal year (2022: 0.9).
Working capital decreased by 3% to €4,478 million (2022 restated: €4,616 million; 2022 previous: €9,645).
Cash flow statement (summary)
Download(XLS, 36 KB)| € in millions | 2023 | 2022 restated | 2022 previous | Growth | Margin 2023 | Margin 2022 |
|---|---|---|---|---|---|---|
| Net income | 238 | 1,222 | 2,117 | -81% | ||
| Depreciation and amortization | 1,478 | 1,157 | 2,973 | 28% | ||
| Loss from the FMC investmentaccounted for using the equity method | 12 | - | -- | |||
| Change in working capital and others | 403 | -348 | -892 | -- | ||
| Operating cash flow - continuing operations | 2,131 | 2,031 | 4,198 | 5% | 9.6% | 9.4% |
| Capital expenditure, net | -1,107 | -1,089 | -1,777 | 2% | ||
| Cash flow before acquisitions and dividends- continuing operations | 1,024 | 942 | 2,421 | 9% | 4.6% | 4.4% |
| Cash used for acquisitions, net | -233 | -783 | -830 | -70% | ||
| Dividends received from Fresenius Medical Care | 106 | 127 | -17% | |||
| Dividends paid | -550 | -403 | -890 | 36% | ||
| Free Cash Flow after acquisitions and dividends - continuing operations | 347 | -117 | -- | |||
| Payments from lease liabilities | -232 | -200 | -975 | 16% | ||
| Free cash flow after acquisitions, dividends, and leases- continuing operations | 115 | -317 | -274 | 136% | ||
| Cash provided by / used for financing activities | 972 | 377 | 261 | 158% | ||
| Effect of exchange rates on change in cash andcash equivalents | -43 | -2 | -2 | -- | ||
| Net change in cash and cash equivalents | 1,044 | 57 | -15 | -- |
Investments and acquisitions
In 2023, the Fresenius Group spent €1,346 million (2022: €2,015 million) for investments and acquisitions. Investments in property, plant and equipment decreased to €1,136 million (2022: €1,182 million) or 5.1% of revenue (2022: 5.5%). This was below the depreciation level1 of €1,160 million. A total of €210 million was invested in acquisitions (2022: €833 million). Of the total capital expenditure in 2023, 84% was invested in property, plant and equipment and 16% was spent on acquisitions.
Acquisition expenses mainly related to already-planned milestone payments in connection with the acquisitions of Ivenix Inc., and the biosimilars business of Merck KGaA, both at Fresenius Kabi. Fresenius Helios and Fresenius Vamed did not make any acquisitions in 2023.
Investments by region
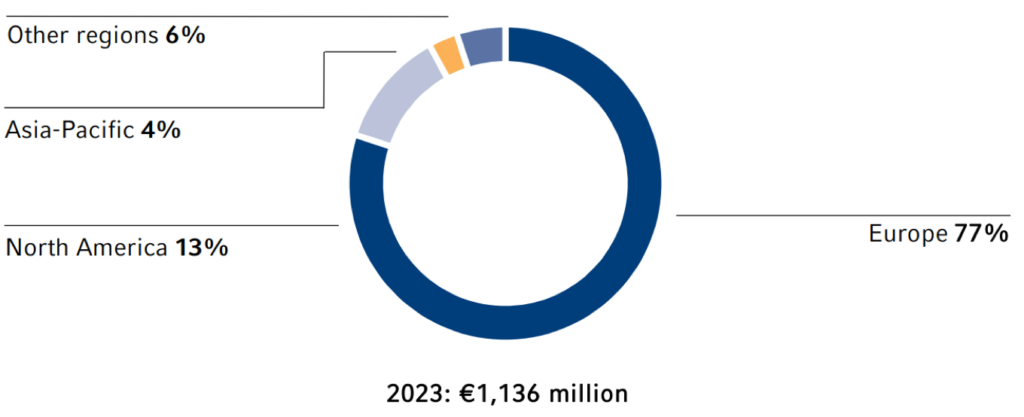
Investments and acquisitions
Download(XLS, 37 KB)| € in millions | 2023 | 2022 | Change |
|---|---|---|---|
| Acquisitions | 210 | 833 | -75% |
| Investment in property,plant and equipment | 1,136 | 1,182 | -4% |
| thereof maintenance | 49% | 57% | |
| thereof expansion | 51% | 43% | |
| Investment in property,plant and equipmentas % of revenue | 5.1% | 5.5% | |
| Total investments andacquisitions | 1,346 | 2,015 | -33% |
The main investments in property, plant and equipment were as follows:
- Optimization and expansion of production facilities for Fresenius Kabi.
- New building and modernization of hospitals at Fresenius Helios. The most significant individual projects were, among other locations, hospitals in Wiesbaden, Duisburg, Wuppertal, and Niederberg, as well as investments in IT infrastructure.
Investment program at Fresenius Kabi
Fresenius Kabi has a global network of production centers. We manufacture our finished medicines in our own plants and, at some sites, also produce active pharmaceutical ingredients. Our investments aim, among other things, is to continuously modernize and automate as well as to in-crease the competitiveness of the plants at a consistently high level of quality.
In the United States, Fresenius Kabi continued its ex-tensive investment program at the manufacturing sites. In 2023, we achieved major milestones in qualifying and validation of the installed equipment and are expecting first regulatory approvals over the course of 2024, bringing the latest technologies for the production of pharmaceutical products online.
Due to the demand for enteral nutrition products in China, we are expanding our production capacity there. At completion we will have invested around €100 million (in-cluding investments from prior years). In the reporting year, we continued work on a new production building on our campus in Wuxi. From 2024 onwards, we will be producing enteral nutrition products there that have the status of Food for Special Medical Purposes. Fresenius Kabi will also be expanding its research and development activities for enteral nutritionEnteral nutritionApplication of liquid nutrition as a tube or sip feed via the gastrointestinal tract. at the Wuxi site.
In the Netherlands, we are converting our site in Em-mer-Compascuum into a production facility for enteral nutrition products and will invest a total of around €160 million in this manufacturing site. The production build-up and capacity expansion are running on track and will be finalized during 2024.
In Austria, we are continuously expanding our produc-tion and logistics site in Graz. In the manufacturing plant, the mobile preparatory area has been enlarged, freeze-drying (lyophilization) expanded, and new filling systems implemented. The plant manufactures sterile drugs such as intravenously administered drugs and large-volume products for parenteral nutritionParenteral nutritionApplication of nutrients directly into the bloodstream of the patient (intravenously). This is necessary if the condition of a patient does not allow them to absorb and metabolize essential nutrients orally or as sip and tube feed in a sufficient quantity.; the site also specializes in complex process requirements and innovative technolo-gies. In the last years we spent €110 million on our core business, and we are further investing €30 million in the vertical integration of our Biopharma business in Graz over the next years.
In France, we continued with the modernization of our plant in Louviers. We are finalizing a new building com-prising an area of 3,300 square meters for the production of freeflex infusion bags there. This also allows us to fur-ther optimize the European production network as a whole. In total, €35 million was invested in the modernization.
In Germany, a new KabiClear production line is being installed at our Friedberg plant to meet the increasing demand in the infusion bottles business in Europe. A total of €40 million is expected to be invested in the course of this project.
Our Haina plant in the Dominican Republic is the central manufacturing facility for disposable products in the field of apheresisApheresisA medical technology in which the blood of a person is passed through a device that separates out one particular blood component and returns the remainder to the circulation. This technology is used for the collection of various blood components by donors, as well as for therapeutic applications for patients. and cell therapy. Driven by the high market demand for plasma and cell therapy products, we have gradually expanded the plant in recent years. In the plasma collection business, in addition to disposable products for our Aurora plasmapheresis system, the disposable products of the successor system, Aurora Xi, are also produced in Haina. Aurora Xi disposable capacity expansion is still ongoing. Production of Comtec sets, for our therapeutic apheresis system, was started in March 2023 after relocation. We are now also working on relocating production of Ivenix sets to this plant.
In order to continue to meet the growing market demand for disposable products, we intend to expand our manufacturing plant in the coming years with highly automated production facilities and clean room capacities. In total, we expect to invest more than US$80 million in the Haina plant going forward.
Investments / Acquisitions by business segment
Download(XLS, 35 KB)| € in millions | 2023 | 2022 | Thereof property, plant and equipment | Thereof acquisitions | Change | % of total |
|---|---|---|---|---|---|---|
| Fresenius Kabi | 658 | 1,243 | 451 | 207 | -47% | 49% |
| Fresenius Helios | 573 | 642 | 573 | 0 | -11% | 42% |
| Fresenius Vamed | 89 | 96 | 87 | 2 | -7% | 7% |
| Corporate / Other | 26 | 34 | 25 | 1 | -24% | 2% |
| Total | 1,346 | 2,015 | 1,136 | 210 | -33% | 100% |
investments, acquisitions, operating chash flow, depreciation and amortization in € millions – five year overview
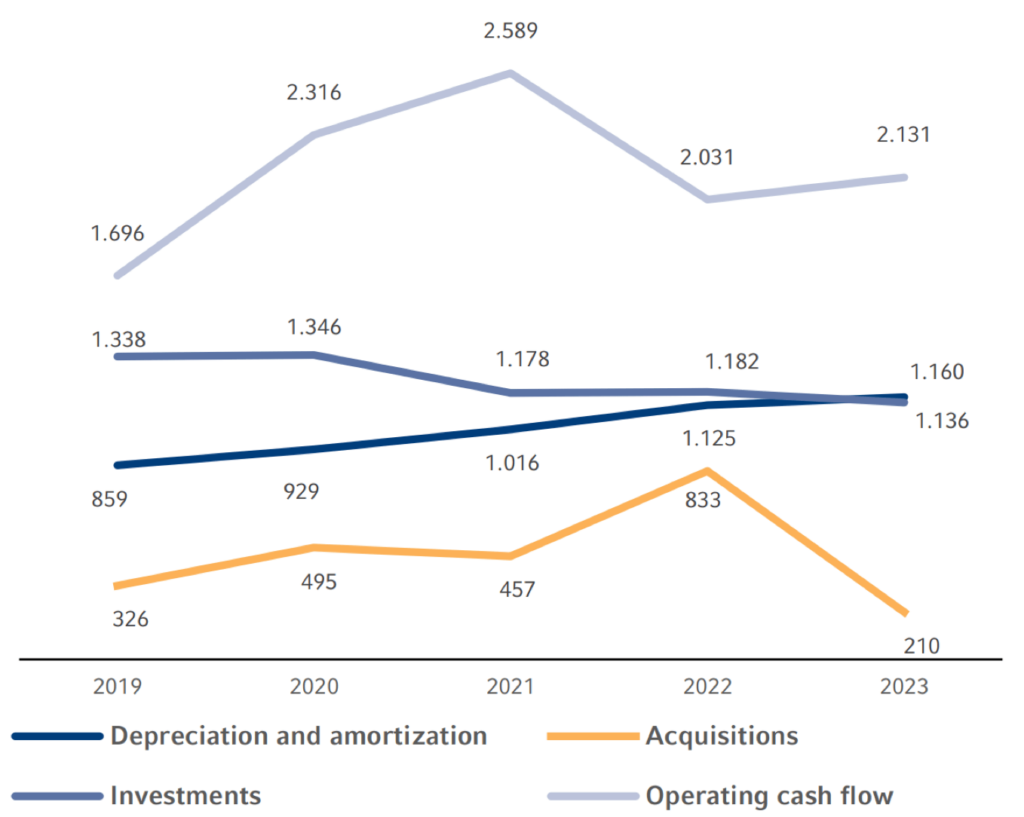
1 Before special items
Divestments
As announced, Fresenius continued to focus and prioritize its core business areas in the 2023 fiscal year as part of its active portfolio management. The following portfolio measures were agreed as part of this:
- Sale of the majority stake in a holding company of the Clínica Ricardo Palma hospital in Lima, Peru, and the associated exit from the Peruvian hospital business
- Sale of the Eugin Group to the global fertility medicine group IVI RMA to further focus Fresenius Helios on its core business; closed on January 31, 2024
- Transfer of the Fresenius Kabi plant in Halden (Norway) to HP Halden Pharma AS, a company of the Prange Group, as part of the Vision 2026 strategy, which aims, among other things, to reduce complexity and optimize capacity utilization in the global production network
- Termination of the activities of Curalie GmbH, a provider of healthcare apps belonging to Fresenius Helios, and sale of the Curalie subsidiaries meditec and ibs
Contact
Fresenius SE & Co. KGaA
Investor Relations
+49 (0) 6172 608-2485
ir-fre@fresenius.com