The knowledge, experience, and commitment of our employees are critical to our success. For this reason, Fresenius values a culture of diversity. The interplay of a wide range of views, opinions, cultural backgrounds, experiences, and values enables us to successfully exploit our potential as a global company.
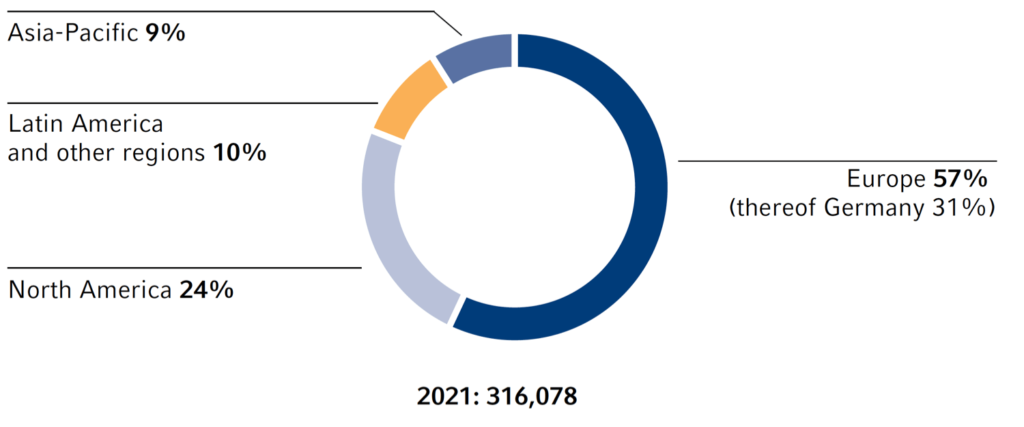
The number of employees increased by 2% to 316,078 employees at the end of 2021. Personnel expenses for the Fresenius Group were €15,610 million in 2021 (2020: €15,128 million), equivalent to 41.6% of sales (2020: 41.7%).
Personnel expenses are above the previous year’s level. Personnel expenses per employee, based on the average number of employees, were €49.8 thousand (2020: €49.5 thousand) and €50.5 thousand in constant currency. In Germany, Fresenius companies have signed tariff agreements with IG BCE, Marburger Bund, and ver.di (labor union for services). There were no significant structural changes to compensation or employment agreements in 2021.
Personnel expenditure
Download(XLS, 35 KB)| € in millions | 2021 | 2020 | 2019 |
|---|---|---|---|
| Fresenius Medical Care | 6,962 | 7,068 | 6,800 |
| Fresenius Kabi | 1,907 | 1,809 | 1,754 |
| Fresenius Helios | 5,707 | 5,270 | 4,878 |
| Fresenius Vamed | 866 | 815 | 774 |
| Corporate / Others | 168 | 166 | 149 |
| Total | 15,610 | 15,128 | 14,355 |
Human resources management
We are constantly adapting our human resources tools to meet new requirements arising from demographics, the transformation to a service economy, the shortage of skilled workers, and employees’ desire to better balance family and career. For example, we offer flexible working hours.
Further information can be found in our Sustainability Report.
Employee recruitment and personnel development
In order to ensure that our long-term needs for highly qualified employees are met, and to recruit new employees, we make use of online personnel marketing, regularly participate in recruiting events and careers fairs, and organize our own recruiting events. In addition, we try to encourage long-term retention with attractive development programs.
employees by region
The approaches and measures for employee recruitment and personnel development in the business segments are based on the market requirements of each segment. They are coordinated, developed, and realized independently for each business segment. At Fresenius, qualifications and experience are the only things that matter in the selection of personnel. Consequently, at Fresenius we have the aspiration that women and men with comparable qualifications will continue to have the same career opportunities. The proportion of female employees in the Fresenius Group increased slightly to 69% as at December 31, 2021 (Dec. 31, 2020: 68%). The proportion of females in services or care is traditionally higher than in the area of production. This is reflected in the proportion of female employees in our business segments: Our business segment Fresenius Helios has with 74% the highest proportion of female employees among the Group. The number of female participants in the Group-wide Long Term Incentive Plan (LTIP 2018) is a good indication of the share of women in management positions. According to this, the ratio of women among the more than 1,800 top executives increased to 32.6% as at December 31, 2021 (Dec. 31, 2020: 31.6% of 1,700 top executives).
Number of Employees
Download(XLS, 35 KB)| Dec. 31, 2021 | Dec. 31, 2020 | Dec. 31, 2019 | Change 2021 / 2020 |
% of total as of Dec. 31, 2021 |
|
|---|---|---|---|---|---|
| Fresenius Medical Care |
130,251 | 133,129 | 128,300 | -2% | 41% |
| Fresenius Kabi |
41,397 | 40,519 | 39,627 | 2% | 13% |
| Fresenius Helios |
123,484 | 116,952 | 106,377 | 6% | 39% |
| Fresenius Vamed |
19,721 | 19,414 | 18,592 | 2% | 6% |
| Corporate / Other |
1,225 | 1,255 | 1,238 | -2% | 1% |
| Total | 316,078 | 311,269 | 294,134 | 2% | 100% |
You can visit our multiple-award-winning careers portal at www.career.fresenius.com. Further information on employment management can be found in our Sustainability Report.