The Management Board makes operational and strategic management decisions based on our Group-wide performance indicators for growth, profitability, liquidity, capital efficiency, and capital management. The most important financial performance indicators for us are explained below and a definition is provided in the glossary of financial terms. There were no changes in the financial performance indicators compared to 2020. There were also no changes in the financial performance indicators of the Fresenius Group due to COVID-19.
The key figures for the financial performance indicators for 2022 of the Group and the business segments can be found in the outlook.
Financial performance indicators
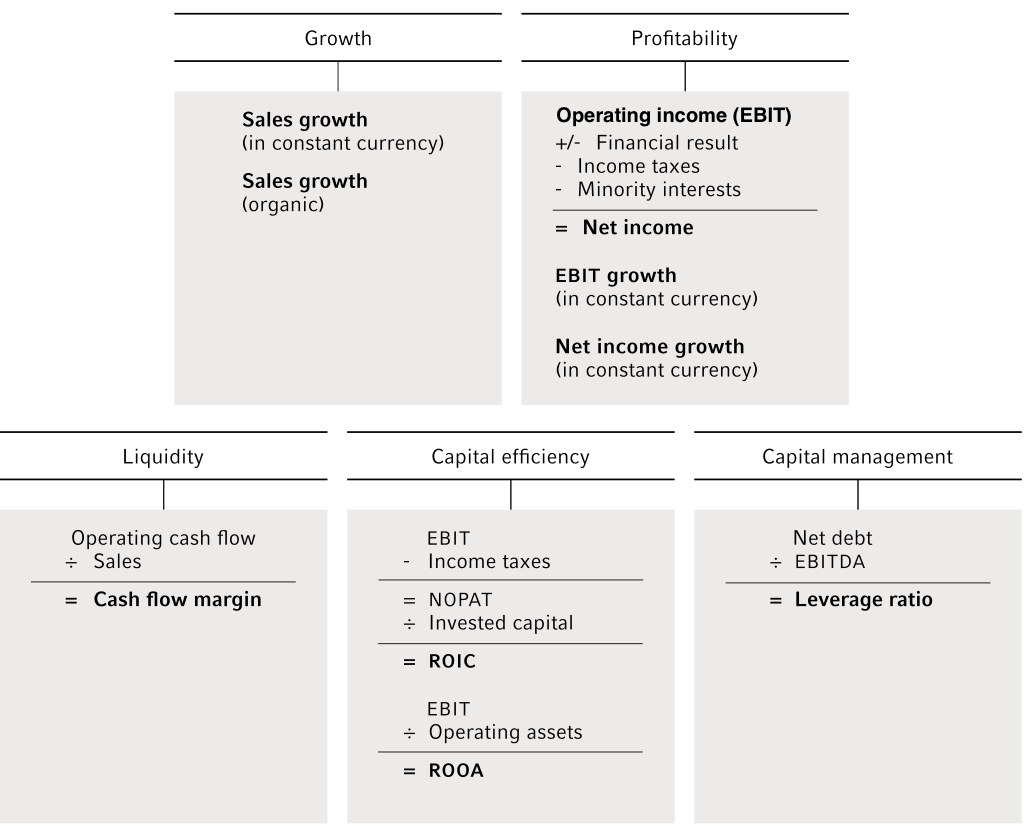
Growth
In line with our growth strategy, sales growth (in constant currency) of the Group and, in our business segments, organic sales growth in particular are of central importance. Fresenius has set itself medium-term growth targets. The targets announced in February 2019 stated that based on the key financial figures for 2019, average annual organic sales growth (CAGR) for the period 2020 to 2023 is expected in the range of 4% to 7%. We had expected small and mid-sized acquisitions to additionally increase the CAGR by approximately 1% point.
In February 2019, when we originally communicated our medium-term targets, no one has foreseen a global pandemic and the related knock-on effects such as increased inflationary pressure.
Hence, we have to refine our expectations based on the financial results for fiscal years 2020 and 2021: we now expect to achieve a sales CAGR at the bottom to middle of the range. Furthermore, we now expect that small and mid-sized acquisitions will add less than 1% point to the sales CAGR.
Profitability
We use earnings before interest and taxes (EBITEBIT (Earnings before Interest and Taxes)EBIT does include depreciation and write-ups on property, plant and equipment. EBIT is calculated by subtracting cost of sales, selling, general and administrative expenses, and research and development expenses from sales.) and EBIT growth (in constant currency) to measure the profitability of the business segments. At Group level, we primarily use net income and its currency-adjusted growth. To facilitate comparison of operating performance across several periods, we adjust the earnings figures for special items where appropriate. Fresenius has set itself medium-term growth targets. The targets announced in February 2019 stated that based on the key financial figures for 2019, net income1,2 is expected to grow organically at a CAGR in a range of 5% to 9% in the period 2020 to 2023. We had expected small and mid-sized acquisitions to additionally increase the CAGR by approximately 1% point.
In February 2019, when we originally communicated our medium-term targets, no one has foreseen a global pandemic and the related knock-on effects such as increased inflationary pressure. Hence, we have to refine our expectations based on the financial results for fiscal years 2020 and 2021: we now expect to achieve the bottom of the range for the net income CAGR. Furthermore, we now expect that small and mid-sized acquisitions will add less than 1% point to the net income CAGR.
1 Net income attributable to the shareholders of Fresenius SE & Co. KGaA
2 Before special items
Liquidity
Within the Group, cash flowCash flowFinancial key figure that shows the net balance of incoming and outgoing payments during a reporting period. margin is used as the main liquidity indicator (see Outlook). In order to further optimize the contributions of our business segments to operating cash flowOperating cash flowOperating cash flow is a financial measure showing cash inflows from operating activities during a period. Operating cash flow is calculated by subtracting non-cash income and adding non-cash expenses to net income., we also use the additional performance indicators DSO1 (days sales outstanding) and SOI1 (scope of inventory). These show the amount of receivables and inventories in relation to the sales and costs of the services rendered during the past reporting period.
Further information on our cash management system can be found in the Opportunities and Risk Report.
Capital efficiency
We work as profitably and efficiently as possible with the capital provided to us by shareholders and lenders. In order to manage this, we primarily calculate the return on invested capital (ROICROIC (Return on Invested Capital)Calculated by: (EBIT - taxes) / Invested capital. Invested capital = total assets + accumulated amortization of goodwill - deferred tax assets - cash and cash equivalents - trade accounts payable - accruals (without pension accruals) - other liabilities not bearing interest.)2 and the return on operating assets (ROOAROOA (Return on Operating Assets)Calculated as the ratio of EBIT to operating assets (average). Operating assets = total assets - deferred tax assets - trade accounts payable - cash held in trust - payments received on account - approved subsidies.)2 (see Investments). An overview of the return ratios by segment can be found in the Group Management Report.
1 Does not reflect a core performance indicator
2 For a detailed calculation of ROIC and ROOA please see the Glossary of financial terms.
Capital management
We use the ratio of net debt and EBITDAEBITDA (Earnings before Interest, Taxes, Depreciation and Amortization)EBITDA is calculated from EBIT by adding depreciations recognized in income and deducting write-ups recognized in income, both on intangible assets as well as property, plant and equipment. as the key parameter for managing the capital structure. This measure indicates the degree to which a company is able to meet its payment obligations. Our business segments usually hold leading positions in growing and mostly non-cyclical markets. Since the majority of our customers are of high credit quality, they generate mainly stable, predictable cash flows. According to the management assessment, the Group is therefore able to use debt to finance its growth to a greater extent than companies in other industries. Our self-imposed target corridor for the leverage ratio is 3.0× to 3.5×.
Non-financial performance targets
In 2021, sustainability was introduced as a non-financial performance target in the Management Board compensation system. The Supervisory Board of Fresenius Management SE has set three ESG targets for each of the five ESG focus areas of quality, employees, innovation, compliance, and the environment for the years 2021 and 2022. These are derived from the company’s materiality analysis and are measured qualitatively using a proprietary ESG scoring methodology. With the ESG targets, the company creates a basis for ESG performance measurement by establishing the ESG target and strategy as well as transparent key performance indicators (KPIs) for performance management in future years. Further information on our sustainability program can be found in the Sustainability Report and in the Compensation Report.
Investment and acquisition process
Our investments and acquisitions are carried out using a detailed coordination and evaluation process. As a first step, the Management Board sets the Group’s investment targets and the budget based on investment proposals. In the next step, the respective business segments and the internal Acquisition & Investment Council (AIC) determine the proposed projects and measures, taking into account the overall strategy, the total investment budget, and the required and potential return on investment. We evaluate investment projects based on commonly used methods, such as internal rate of return (IRR) and net present value (NPV). Within the framework of the due diligence process, opportunities and risks associated with the potential acquisition target are analyzed and assessed. To this end, we review the business model, the key financial figures and tax issues, and the resulting company valuation. In addition, we comprehensively analyze the market and competitive environment, the regulatory framework and the legal aspects. The audit also covers various issues relating to compliance, production, research and development, quality, information technology, human resources, and the environment. Based on investment volume, a project is submitted for approval to the executive committees or respective managements of the business segments, to the Management Board of Fresenius Management SE, and / or its Supervisory Board.
You can find more details on our key performance indicators in our interactive tool3 on our website at www.fresenius.com/interactive-tool.
3 Does not reflect a core performance indicator
Group1
Download(XLS, 36 KB)| Targets 20212 | 2021 | 2020 | 2019 | 2018 | 2017 | |
|---|---|---|---|---|---|---|
| Sales growth (in constant currency) | Mid single-digit percentage growth | 5% | 5% | 6% | 6% | 16% |
| Net income3 growth (in constant currency) | Around top-end of low single-digit percentage growth | 5% | -3% | 0% | 7% | 21% |
| Liquidity and capital management | ||||||
| Cash flow margin | 10% to 12% | 13.5% | 18% | 12.0% / 9.9%4 | 11.2% | 11.6 % |
| Net debt / EBITDA5 | Around the top-end of 3.0× to 3.5×6 | 3.51x | 3.44x | 3.61× / 3.14×4 | 2.71× | 2.84× |
| Capital efficiency | ||||||
| Return on invested capital (ROIC)7 | Decrease by 40 to 70 basis points compared to 2020 level | 5.9% | 6.5% | 6.7% / 7.4%4 | 8.3% | 8.0% |
| Return on operating assets (ROOA)7 | Decrease by 50 to 100 basis points compared to 2020 level | 6.5% | 7.3% | 7.6% / 8.2%4 | 9.0% | 9.4% |
Business Segments1
Download(XLS, 37 KB)| Targets 20212 | 2021 | 2020 | 2019 | 2018 | 2017 | |
|---|---|---|---|---|---|---|
| Fresenius Medical Care | ||||||
| Sales growth (in constant currency) | Expecting to be at the lower end of the guidance range of low-to-mid single-digit percentage growth | 2% | 5% | 5% | 4% | 9% |
| Net income growth8, 9 (in constant currency) | Expecting to be at the lower end of the guidance range of high-teens to mid-twenties percentage decline | -23% | 12% | -2% | 4% | 7% |
| Fresenius Kabi | ||||||
| Sales growth (organic) | Low-to-mid single-digit percentage growth | 4% | 4% | 4% | 7% | 7% |
| EBIT growth (in constant currency) | Around the top end of the low single-digit percentage guidance range | 7% | -6% | 3% | 2% | 8% |
| Fresenius Helios | ||||||
| Sales growth (organic) | Mid single-digit percentage growth | 7% | 4% | 5% | 3% | 4% |
| EBIT growth (in constant currency) | High single-digit percentage growth | 10% | 0% | -4% | 0% | 54% |
| Fresenius Vamed | ||||||
| Sales growth (organic) | Mid-to-high single-digit percentage growth | 11% | -8% | 16% | 16% | 6% |
| EBIT growth (in constant currency) | High double-digit € million amount | €101 million | €29 million | 19% | 45% | 10% |
| 1 Growth rates are based on the assumptions of the respective annual forecasts and are adjusted for special items and, if applicable, other effects affecting the underlying growth (adjustments to new accounting standards, acquisitions/divestments, acquisition costs, or cost-saving programs). | ||||||
| 2 Including expected COVID-19 effects (updated November 2021) | ||||||
| 3 Net income attributable to shareholders of Fresenius SE & Co. KGaA | ||||||
| 4 Excluding IFRS 16 effect | ||||||
| 5 Both net debt and EBITDA calculated at LTM average exchange rates; before special items, pro forma closed acquisitions / divestitures | ||||||
| 6 Around the top-end of the self-imposed target range of 3.0× to 3.5×; excluding further potential acquisitions | ||||||
| 7 Before special items, pro forma acquisitions | ||||||
| 8 Net income attributable to shareholders of Fresenius Medical Care AG & Co. KGaA | ||||||
| 9 Special items are effects (when consolidated at the Fresenius Group: special items), that are unusual in nature and were not foreseeable or not foreseeable in size or impact at the time of giving guidance. | ||||||