Climate change and its effects are also impacting Fresenius: in health care facilities we have to prepare for rising temperatures and the increase in severe weather events in order to protect the health of patients at all times. Our production processes and the operation of health care facilities require a high level of energy input. Energy-efficiency measures can lead to short- and long-term cost savings; in addition, through the increased usage of renewable energies, they also make an important contribution to climate protection.
Our approach
In energy management and climate protection, our aim is to go beyond the legal framework to identify ways of minimizing the impact on the environment and to implement these in our management approaches. In 2021, the divisions focused primarily on the topics of efficiency enhancement, energy saving, and thus the reduction of CO2 emissions.
Uninterrupted energy supply is a top priority for Fresenius in order to ensure patient safety and reliable production or care. We always examine possible energy-saving measures with the greatest care. The energy management system is geared to the requirements of our business segments and is certified according to ISO 50001. We are constantly expanding the number of certified sites.
Fresenius constantly invests in new buildings and modernizations that meet the latest energy standards and legal requirements.
Fresenius Medical Care
Fresenius Medical Care monitors the energy consumption at its production sites and the electricity usage in its dialysisDialysisForm of renal replacement therapy where a semipermeable membrane – in peritoneal dialysis the peritoneum of the patient, in hemo dialysis the membrane of the dialyzer – is used to clean a patient’s blood. clinics. In Europe, Middle East, and Africa, the company has set local electricity-related targets.
Further information on the management approach can be found in the Environmental management section.
Progress and measures in 2021
In 2021, Fresenius Medical Care introduced measures to reduce energy consumption at several of its production sites. For example, the business segment has started piloting an energy management system at some of the dialysis clinics in the United States that aims to improve energy efficiency by centralizing the control of energy use. The system is expected to be rolled out in 2022 across some 800 locations. In addition, the business segment implemented various projects as part of its Green and Lean Initiative. For example, the company continued to replace fluorescent lighting with LED lighting in selected warehouses and production areas to save energy.
Fresenius Medical Care also assessed the share of renewable energy impact within its total electricity consumption. To do this, the company considered the country-specific average share of renewables needed to produce electricity. According to this calculation, renewables accounted for 22% of total electricity consumption in 2021, compared with 21% in 2020. In the United States, the business segment purchased 140,000 MWh worth of Green-e certified Renewable Energy Certificates (RECs) in 2021. These correspond to about 54,000 t of Scope 2 CO2 equivalent and account for 10.7% of the business segment's global Scope 2 emissions (calculated based on location-specific emission factors).
Fresenius Kabi
The focus of the energy management system at Fresenius Kabi is on improving energy performance and preventing excessive use of energy. Key opportunities are reducing energy and emissions in proportion to the volume of production activities. Fresenius Kabi derives its energy mainly from external providers. This includes the purchase of renewable energy such as hydropower, solar, or wind power. The business segment also generates electricity in its own facilities and uses, e. g., combined heat and power systems. Fresenius Kabi wants to increase the share of renewable energy in its overall energy consumption.
Local measurable objectives and energy targets are derived from the business segment’s global energy policy. As stated in the chapter Environmental management, Fresenius Kabi has matrix certification for its global energy management system, which is audited annually and certified by TÜV Rheinland.
Responsibility for energy management lies with the divisional and local organizations; global management responsibility lies with the central EHS function, which reports to the responsible member of Fresenius Kabi’s Management Board.
Progress and measures in 2021
In 2021, the management approach and governance structure of Fresenius Kabi remained as reported in 2020. Progress focused on increasing energy efficiency and reducing CO2 emissions in proportion to the volume of its production activities.
Fresenius Kabi’s manufacturing plant in Quy Nhon, Vietnam, replaced two dieselboilers with two wood pellet boilers in 2021. This will lead to a reduction in CO2 emissions of approximately 426 tons per year. Furthermore, the business segment’s manufacturing plant in Graz, Austria, installed LED lights at the warehouse and packaging center in 2021, which will lead to a reduction of about 702 MWh per year.
Some sites purchase only CO2-neutral electricity from external sources, while other sites supplement energy needs by using solar panels generating CO2-neutral electricity or wood pellet boilers to generate steam. In 2021, for instance, Fresenius Kabi put into operation the third solar energy system at its plant in Haina.
For energy management, the Global Competence Cluster Energy and Water Management, an internal information platform for global exchange, has already produced ideas for improvements. Four energy-saving projects were concluded in 2021. Furthermore, potential exemplary methods for the intracompany transfer and new projects are currently being evaluated. Four projects concluded in 2021 will lead to savings of approximately 241.3 t of CO2 annually; the savings of another project will be evaluated in 2022.
Fresenius Helios
The rising temperatures resulting from climate change are also affecting Fresenius Helios’ business operations, especially in Spain. In recent years, refrigeration technology, which serves to cool technical equipment and hospital rooms, has become more important for hospital operations than heat generation. In addition, more frequent severe weather events such as heavy rainfall or flooding may pose a threat to the health care services of hospitals.
Further impacts of climate change on human health are likely: changes such as vector-borne infectious diseases (e.g., by mosquitoes, which are spreading into new areas as a result of climate change) can, for instance, influence the range of treatments offered by the facilities.
In Germany, the Infrastructure business unit has established a central energy procurement and management system that records the energy consumption of each site. Helios Germany uses this system to compare consumption figures and to initiate improvement measures. Helios Germany’s own energy supplier, HKG Energiedienstleistungen GmbH, is responsible for energy procurement.
Various parameters can be monitored via a central portal – from the price of electricity on the energy market to the hospitals’ respective energy consumption. In order to monitor energy flows more precisely, a measurement concept is being implemented at relevant sites. This is an essential component to meet the requirements of the ISO 50001 standard. With its central energy procurement and management system, Fresenius Helios can compare the consumption values of the clinics, initiate targeted improvement measures, and share best practices from individual clinics within the company.
To further improve the energy efficiency of Helios Germany, the Infrastructure business unit set up several working groups, such as AG Energie. They are, for example, looking into how energy can be saved in the technologies used in everyday hospital operations.
Helios Germany covers a low double-digit percentage of total electricity consumption with self-generated electricity. This contributes to a secure and uninterrupted energy supply for the clinics. As a result, Helios saves CO2 emissions at the German clinic sites compared to complete external procurement.
Helios Spain analyzes its energy management risks and uses renewable energy sources in some clinics. In order to ensure an uninterrupted energy supply at all times, every hospital has a mains backup system: in the event of a power outage, this system guarantees a secure supply of electricity for the principal energy consumers in the clinics within a few seconds. To safeguard this protection, these emergency power systems are inspected and tested regularly, at least once a year.
Electricity and natural gas are purchased centrally at Helios Spain. The business unit also has an energy manager, who monitors the consumption of all hospitals and provides corresponding data for evaluation and comparative analyses. In addition, each hospital reviews and implements specific energy-saving measures. Seven Helios Spain hospitals use thermal solar energy and photovoltaic systems to generate energy. To generate thermal energy, the division also uses miniature combined heat and power plants at two hospitals and biomass at another hospital.
Progress and measures in 2021
In order to improve the data situation regarding electricity consumption and to comply with the requirements of the German Renewable Energies Act (EEG), Helios introduced a Group-wide measurement and delimitation concept in 2021. Corresponding metering technology measures all electricity consumption at all hospital locations and distinguishes between Helios’ own consumption and that of third parties, e. g., units rented by flower stores.
Since 2021, Helios Germany has been developing a system for collecting and evaluating Scope 3 emissions. At Helios Spain, the emissions from business trips by air and rail have been calculated. In addition, the emissions of the journeys made by workers to their workplace have been estimated with a mobility survey.
Helios Germany introduced guidelines throughout the country for the establishment of charging infrastructure by service providers, and for the charging of electric vehicles. At some pilot sites, the business segment is trialing electric-powered patient and visitor transport on the hospital premises. In Wiesbaden, Germany, for example, Helios Germany is cooperating with local public transport providers on the first autonomous electric vehicle.
In 2021, Helios Spain analyzed whether technical installations needed to be renewed. The business unit also conducted a study on the use of solar energy systems.
Fresenius Vamed
The respective management teams are responsible for energy and emission management at Fresenius Vamed’s health care facilities. The effectiveness of energy management measures in the certified business segments is assessed by regular independent audits as part of ISO 50001 certification. In Germany, this certification was implemented together with the Infrastructure business unit of the Fresenius Helios hospitals.
CO2-neutral power supply
The majority of Fresenius Vamed’s consolidated health care facilities in Austria are supplied with CO2-neutral electricity. Fresenius Vamed also obtains a small amount of energy from its own combined heat and power plants in Germany. Swiss health care facilities purchase regional electricity, some of which comes from renewable sources.
Progress and measures in 2021
In 2021, the management approach and governance structure of Fresenius Vamed remained as reported in the previous year. Progress focused on the ongoing internal preparation of the process documentation as part of the ESG component of variable Management Board compensation. Furthermore, a pilot project was initiated in order to be able to collect data on Scope 3 emissions in the future from industrial activities in Austria, Germany, Switzerland, and the Czech Republic.
Evaluation1
GRI 302/103-3, GRI 302-1, -3, GRI 305/103-3, GRI 305-1, -2, -4, -5
We calculate our Scope 1 and 2 GHG emissions following the methodology of the Greenhouse Gas Protocol, using the latest version from the UK Department for Environment, Food and Rural Affairs (DEFRA). We also use the emission factors of the International Energy Agency (IEA) for electricity consumption. We additionally use these emission factors to calculate the indirect emissions from electricity.
group energy consumption by source
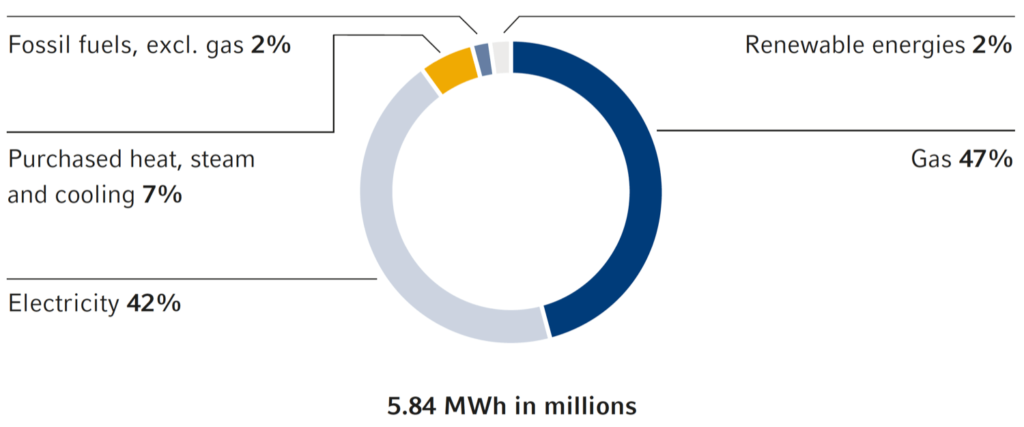
Fresenius1 consumed a total of 5.8 million MWh of energy in 2021, an increase of 6% compared to the previous year; the main energy sources were gas (thereof 97% natural gas) and district heating. When purchasing energy, we consider efficiency requirements and changes in demand. We are exploring the possible use of renewable energies and already generate our own electricity at numerous sites. In 2021, the share of renewable energy consumption was 2%. Among the main energy sources, electricity demand is our most material driver of CO2 emissions. Accordingly, Scope 2 emissions are higher than Scope 1 emissions in all business segments. In 2021, Fresenius generated a total of 1,524 thousand tons of CO2 equivalents (2020: 1,512 thousand tons).
Fresenius Group1 Energy consumption
Download(XLS, 35 KB)| MWh in millions | 2021 | 2020 | 2019 | 2018 | 2017 |
|---|---|---|---|---|---|
| Fresenius Medical Care | 2.61 | 2.49 | 2.43 | 2.38 | n. a. |
| Fresenius Kabi | 1.79 | 1.66 | 1.64 | 1.65 | 1.57 |
| Fresenius Helios | 1.24 | 1.16 | 1.09 | 1.14 | 0.95 |
| Fresenius Vamed | 0.19 | 0.18 | 0.16 | 0.17 | 0.05 |
| Total | 5.84 | 5.47 | 5.32 | 5.34 | n. a. |
Fresenius Group1 relative energy consumption
Download(XLS, 35 KB)| in MWh | 2021 | 2020 | 2019 | 2018 |
|---|---|---|---|---|
| Energy consumption / € 1 million sales | 156 | 151 | 150 | 159 |
| Energy consumption / FTE | 20.9 | 19.8 | 20.3 | 21.7 |
Fresenius Group1 Greenhouse Gas emissions (GHG) scope 1 and 2
Download(XLS, 36 KB)| t CO2 equivalents in thou. | 2021 | 2020 | 2019 | 2018 | 2017 |
|---|---|---|---|---|---|
| Fresenius Medical Care | 766 | 770 | 775 | 776 | n. a. |
| Scope 1 | 263 | 242 | 227 | 219 | n. a. |
| Scope 2 | 503 | 527 | 547 | 557 | n. a. |
| Fresenius Kabi | 443 | 417 | 409 | 424 | 422 |
| Scope 1 | 170 | 160 | 169 | 169 | 174 |
| Scope 2 | 273 | 256 | 239 | 255 | 248 |
| Fresenius Helios | 277 | 287 | 284 | 296 | 255 |
| Scope 1 | 122 | 112 | 107 | 114 | 103 |
| Scope 2 | 155 | 175 | 178 | 182 | 152 |
| Fresenius Vamed | 39 | 39 | 36 | 38 | 9 |
| Scope 1 | 23 | 21 | 18 | 19 | 3 |
| Scope 2 | 16 | 17 | 18 | 19 | 6 |
| Total | 1,524 | 1,512 | 1,504 | 1,534 | n. a. |
| Scope 1 | 578 | 536 | 522 | 521 | n. a. |
| Scope 2 | 946 | 976 | 982 | 1,013 | n. a. |
| GHG emissions in t CO2 e | |||||
Fresenius Group1 Relative GHG emissions scope 1 and 2
Download(XLS, 35 KB)| t CO2 equivalents in thou. | 2021 | 2020 | 2019 | 2018 |
|---|---|---|---|---|
| t CO2 equivalents / € 1 million sales | 41 | 42 | 42 | 46 |
| t CO2 equivalents / FTE | 5.5 | 5.5 | 5.8 | 6.2 |
At Fresenius Medical Care, total emissions (Scope 1 and Scope 2) decreased by 1% in 2021 compared with 2020. The reported Scope 1 emissions increased by 8% in 2021 compared to 2020. This increase is due to more accurate data reporting and a change in the reporting approach, with the reporting tool now automatically calculating conversions for natural gas. The reported Scope 2 emissions decreased by 5% due to enhanced data reporting as well as lower emission factors provided by the IEA. Most of the Scope 1 and Scope 2 GHG emissions stem from energy consumption. Fresenius Medical Care is currently assessing Scope 3 emissions that arise from activities or assets that the company does not own or control along its value chain.
Each year, the headquarters of Fresenius Kabi are audited by TÜV Rheinland with regard to the ISO 50001 energy management certification. In 2021, no observations were detected, confirming that the energy management system is in line with the requirements of ISO 50001. Further, Fresenius Kabi successfully achieved the self-imposed target for the continuing roll-out of the ISO 50001 energy management system in accordance with the internal implementation plan, thus expanding the coverage of the management system to additional manufacturing plants. The ongoing COVID-19 pandemic had no impact on the roll-out of the energy management system according to ISO 50001 in 2021.
In addition, the focus in the past fiscal year was on increasing energy efficiency and the share of renewable energy in total energy consumption. Furthermore, the COVID-19 pandemic had an impact, e. g., on energy performance in some countries due to the significant energy baseload in combination with COVID-19-related fluctuations in production, which affected energy performance and consequently the generation of emissions. Energy performance was also affected in 2021 by expansion measures and regulatory validation processes, e. g., the testing of new production lines for quality requirements.
The spread of coronavirus required our Spanish hospitals to increase ventilation, so the energy consumption required for air conditioning increased in some facilities in 2021.
Energy consumption per hospital bed1
Download(XLS, 35 KB)| MWh/bed | 2021 | 2020 | 2019 | 2018 | 2017 |
|---|---|---|---|---|---|
| Total | 30.4 | 31.0 | 30.5 | 31.9 | 34.1 |
| 1Applies to all hospitals of Fresenius Helios; 2017 only Germany. | |||||
At Fresenius Vamed, operations in 2021 concentrated on developing the management approach to climate protection in connection with the ESG component of variable Management Board compensation. Relevant collection and control processes were also defined. Furthermore, the business segment was involved in the diverse discussions at the Fresenius Group on the definition of a CO2 reduction target. As the processes for the above items are still ongoing, no changes in management approaches are to be reported for 2021. With regard to energy consumption, 2021 can be considered a return to a normal year at Fresenius Vamed. After many facilities were closed for longer periods in 2020 due to the COVID-19 pandemic, consumption levels in 2021 returned to the pre-pandemic level.
1 Fresenius Medical Care figures include energy consumption and water withdrawal at production sites, as well as electricity consumption and water withdrawal at dialysis centers. Emissions include Scope 1 and 2 emissions of production sites and Scope 2 emissions of in-center treatments in dialysis clinics. The data from Fresenius Helios encompasses as of 2018 all hospitals in Spain and the clinics in Latin America as of 2020. Fresenius Vamed’s data includes all fully consolidated health care facilities and service entities, and, as of 2018, the German post-acute care business transferred from Fresenius Helios to Fresenius Vamed. Newly acquired companies are included in the second year of consolidation, at the latest. If data of the business segments is not available in time, it is extrapolated on the basis of existing data. An adjustment will be made in the next report. Prior-year information was adjusted to conform to the current year’s presentation. Due to rounding, individual numbers and percentages presented in this report may not precisely reflect the absolute figures